Plotting the Graph ⚠
Under development
You should not use the plotting feature in a production enviroment. We are still developing and testing it.
Dependencies
This feature requires the library pygraphviz.
Every transformer has two methods to plot the graph of the flow:
.to_dot(): which is used to export the transformer as graph using the dot format..to_image(): used to export the transformer as an image.
Example
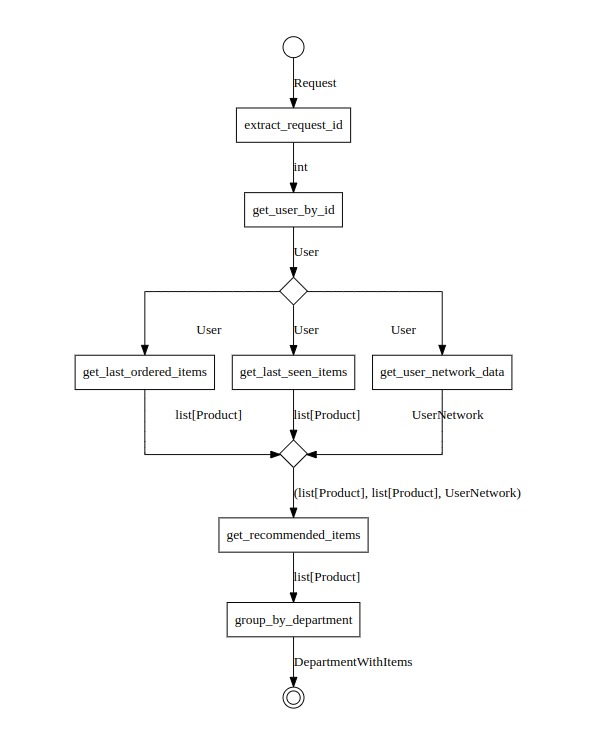
Assume the following graph:
@transformer
def extract_request_id(request: Request) -> int: ...

@transformer
def get_user_by_id(user_id: int) -> User: ...

@transformer
def get_last_seen_items(user: User) -> list[Product]: ...

@transformer
def get_last_ordered_items(user: User) -> list[Product]: ...

@transformer
def get_user_network_data(users: User) -> UserNetwork: ...

@transformer
def get_recommended_items(
    last_seen_items: list[Product],
    last_ordered_items: list[Product],
    user_network: UserNetwork
) -> list[Product]: ...

@transformer
def group_by_department(items: list[Product]) -> DepartmentWithItems: ...


get_user_recommendations = (
    extract_request_id
    >> get_user_by_id
    >> (
        get_last_ordered_items,
        get_last_seen_items,
        get_user_network_data,
    )
    >> get_recommended_items
    >> group_by_department
)
We can call the method .to_image() of the get_user_recommendations transformer instance:
get_user_recommendations.to_image('get_user_recommendations.png', with_edge_labels=True)
The resulted plot is:
We can also call the .to_dot() method:
get_user_recommendations.to_dot('get_user_recommendations.dot', with_edge_labels=True)
Then, we can use any dot visualizer tool to plot the graph. For example, we can use edotor.net. We need just to copy the content of get_user_recommendations.dot file and paste it on edotor.net editor.
Click here to see this graph on edotor.net.
Important
We are already working on a dedicated solution to visualize and interact with Gloe graphs in real time during development.